
Executive Summary
Turning Biometric Data into Actionable Marketing Insights
Company
Senstream
Timeline
6 months
Project
Wearable app
My Role
PM/UX Lead
The Problem
- Brands lacked reliable tools to measure authentic emotional response
- Traditional surveys failed to capture subconscious consumer reactions
Outcome
- Transformed biometric sensing technology into a commercially viable enterprise platform
- Clarified product positioning for marketing and research buyers
- Established scalable UX foundation for emotion-based analytics
My Role
- Experience Strategist and UX Lead
- Defined product strategy
- Translated biometric signal processing into actionable marketing insights
Detailed Case Study
Context and Challenge
Why This Problem Mattered
- Marketers relied on self-reported feedback disconnected from physiological truth
- Biometric outputs were technically sophisticated but difficult to operationalize
- Autonomic nervous system signals were surfaced as raw streams, not decisions
- Analytics emphasized data density over marketing relevance
- Without usable UX, the technology risked remaining the domain of researchers and academics
- Commercial growth required translating machine learning outputs into clear business value
Constraints and Complexities
- A wearable ring captured autonomic nervous system responses in real time
- Biometric data streamed to a mobile application for machine learning analysis
- Multiple rings within a session required sophisticated mesh networking
- Physiological signals required contextualization to identify emotional reactions
- Outputs needed verifiable accuracy without overwhelming users
- Biometric emotion analytics is an emerging category
- UX had to balance scientific credibility with executive clarity
My Role and Decision Ownership
- Defined how physiological signals translated into marketing insight
- Reframed the platform around human-friendly signals rather than data overload
- Designed workflows that surfaced emotional moments with clear interpretation
- Facilitated executive workshops and hands-on design exploration
Creating a Usable Solution
The Data Scientists Loved
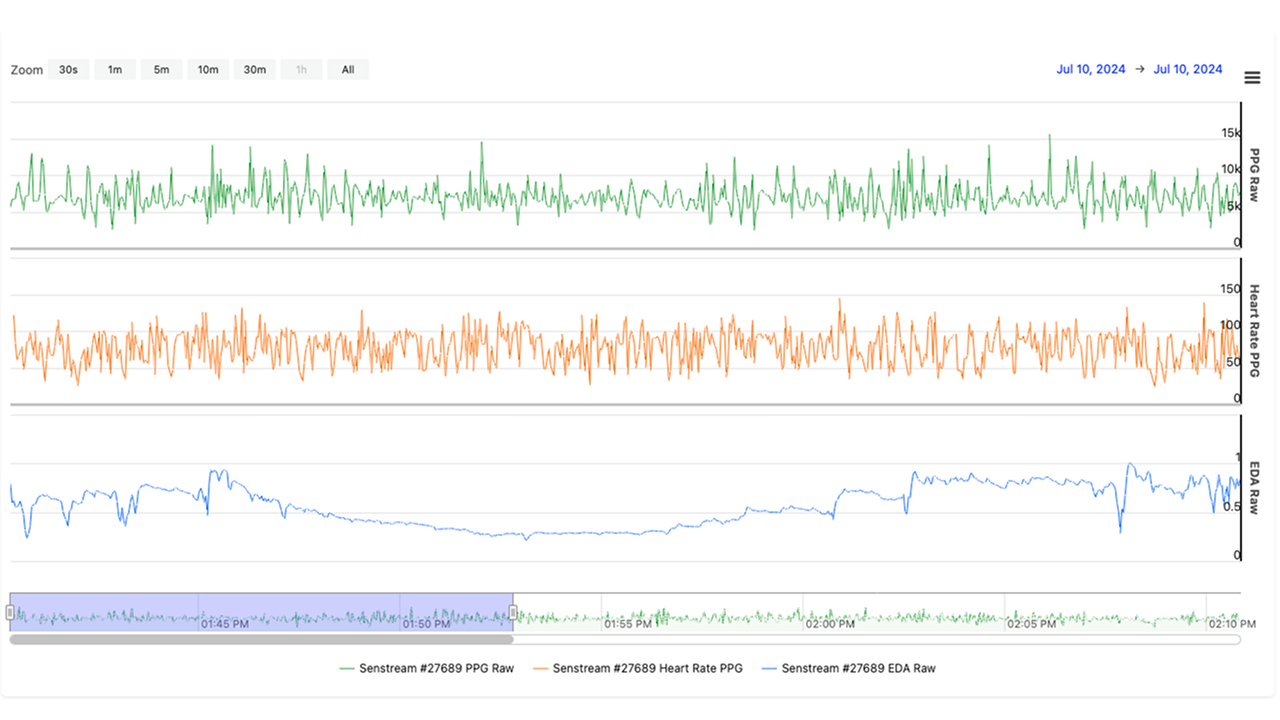
We started with streams of biometric signals — EDA, heart rate, HRV, ECG — flowing across clean, precise line charts. To researchers, they were rich with meaning. To marketers, they were unreadable.
The data was valid. But it didn’t explain itself. The charts existed without a story.
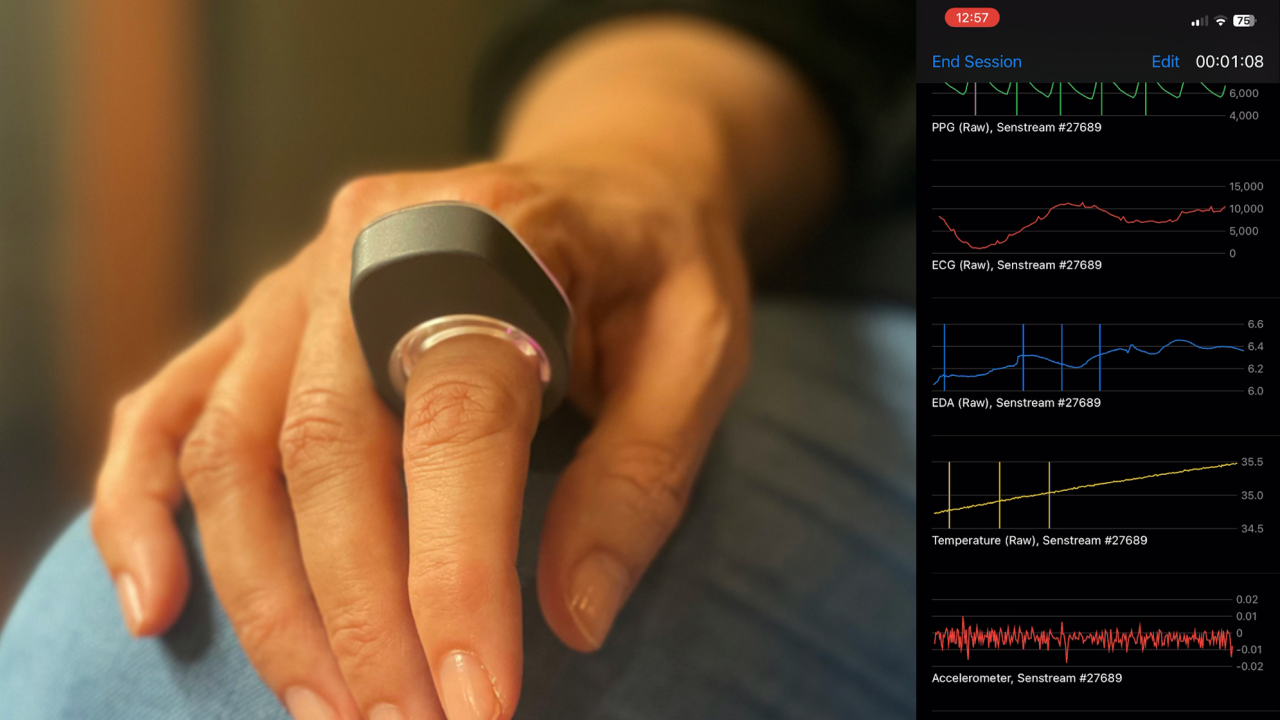
Senstream Ring
The Senstream Ring streams biometric data to mobile devices
Rich Data
That data is portable to any platform needed for analysis
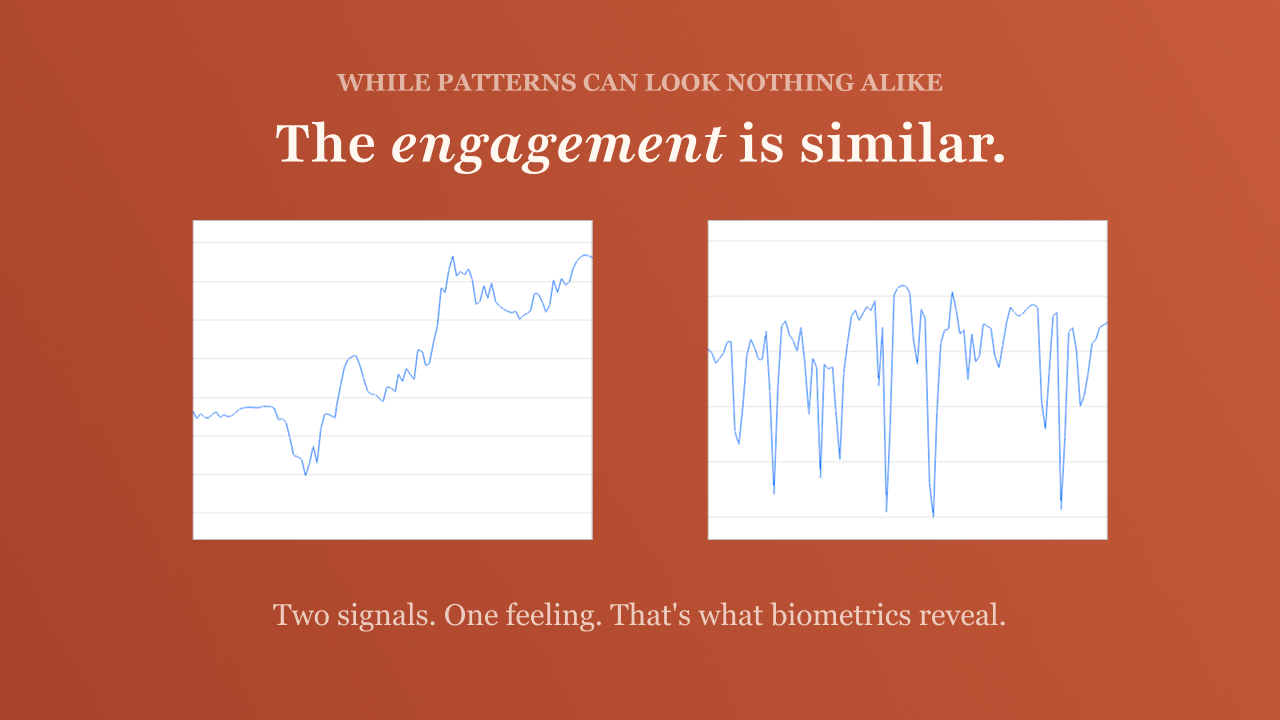
Emotion Isn’t Obvious
We expected emotion to look dramatic — a clear spike, a sharp rise.
Instead, it appeared in many forms. Sometimes gradual. Sometimes clustered. Sometimes subtle. The same human reaction could produce completely different patterns.
Without context, arousal was just movement on a chart.
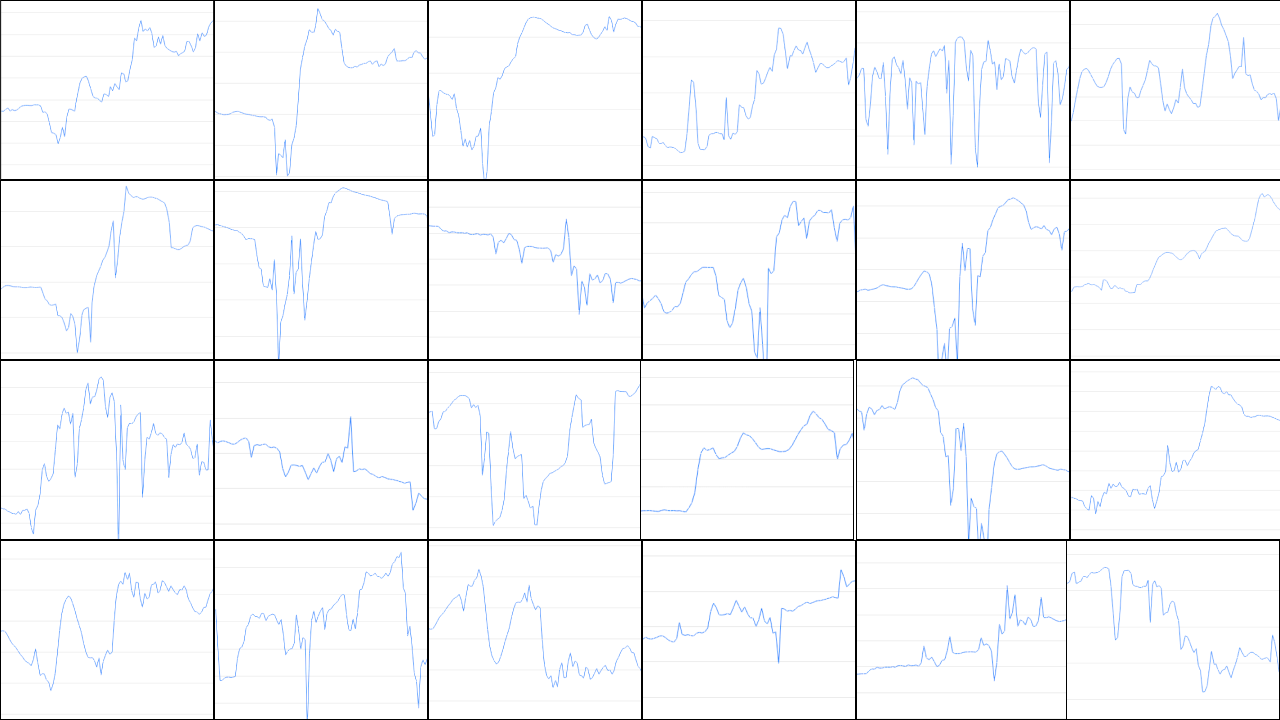
Creating Structure
So we went manual. Thousands of moments were reviewed and labeled, grouping different-looking patterns that represented the same underlying reaction.
This created a dataset that could be used to train a machine learning model to evaluate live data. A 80/20 split of the training data resulted in 93% accuracy.
From Signals to Insight
Now with an ML model, we could apply that intelligence to any media and visualize the audience's reaction while they wore the Senstream ring.
This prototype has allowed us to measure emotional reactions across a range of media
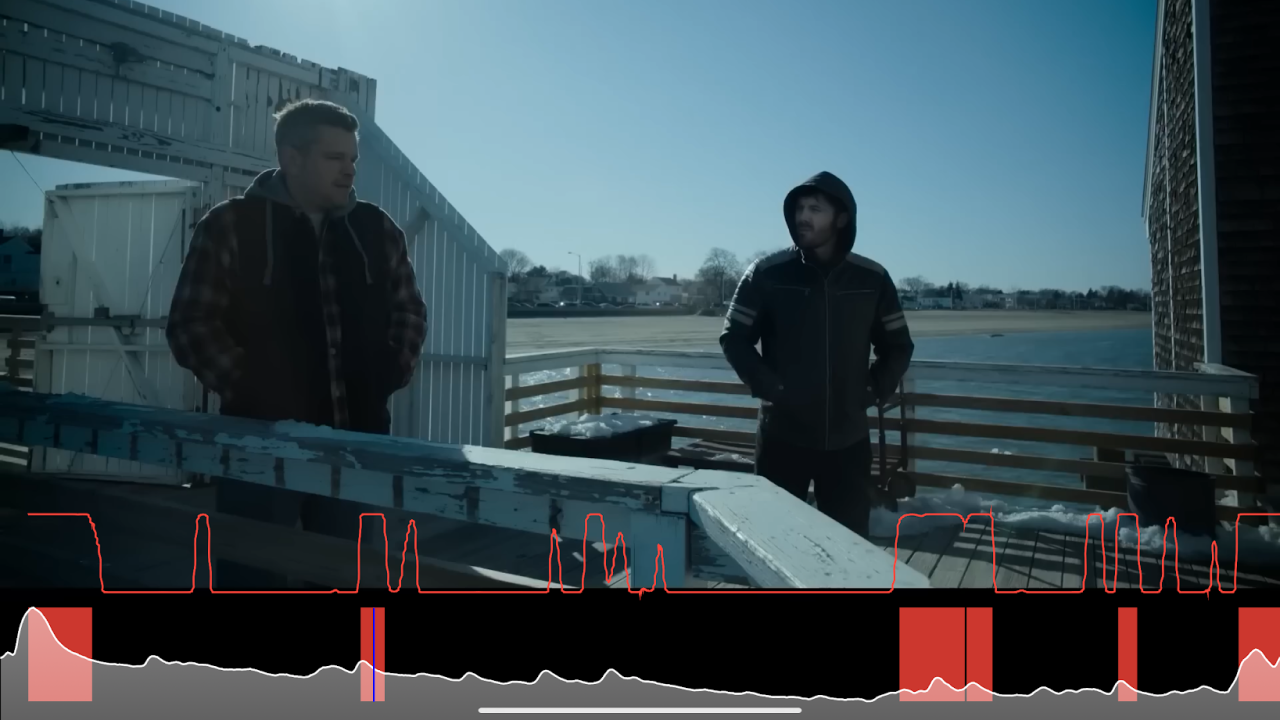
Commercials/Film Trailers/Political Ads
We could map emotional lift scene by scene, revealing which moments truly landed.
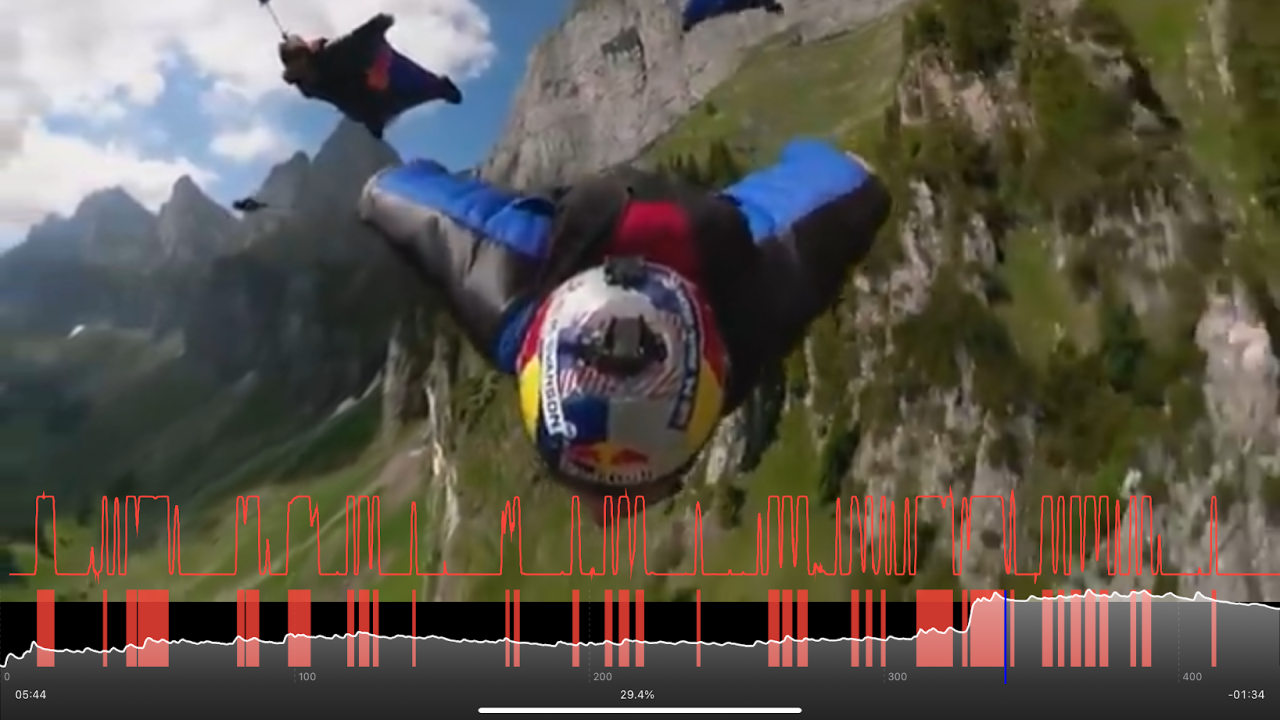
Sporting Events
We could track sustained intensity, pinpointing the seconds that drove peak engagement.
Next Gen Concept
I started to explore different concepts around what might analysis look like with the aid of GenAI and running larger studies where we could view the data around individuals and the group as a whole.
Interactive Prototype
View group results, hover states for activations, run analysis of the results.
Impact and Reflection
Product Impact
- Created clear commercialization pathway for wearable-based emotion analytics
- Increased enterprise usability and adoption readiness
Outcome
- Strengthened positioning in the competitive neuromarketing space
- Improved credibility in sales discussions
- Created an experience that allows investors/partners to immediately see potential applications
Organizational Impact
- Unified scientific innovation with product strategy
- Accelerated transition from research capability to scalable offering